Educational use only. This website does not give investment advice.

TradingView Platform Basics

Technical Analysis

TradingView Platform Basics

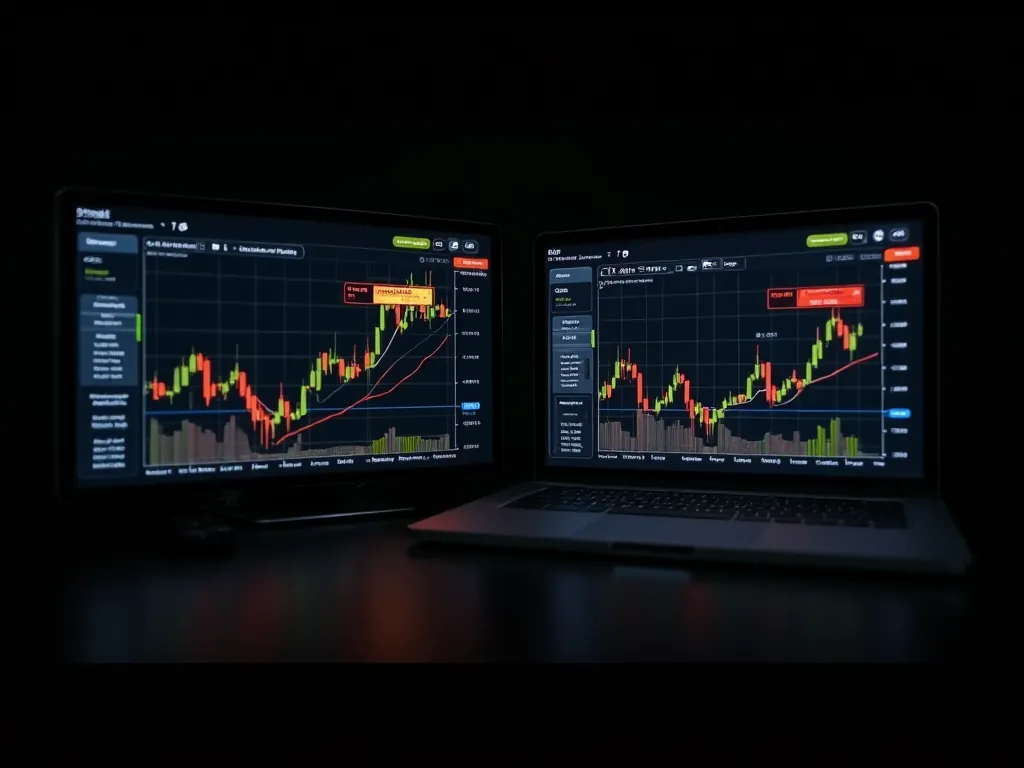
TradingView is a widely used web-based charting platform. This material explains how to find your way around it, from searching for a symbol and changing chart types and timeframes to adding indicators, drawing trendlines and saving layouts. It also covers watchlists, price alerts and the basics of the screener, so learners can practise the ideas from other technical analysis materials on real charts.

Levels
4
Starting from
195 credits
Category
Technical Analysis
TradingView Platform Basics
4 levels
Each level is unlocked separately

Choose a level

Choose a level to see what it includes

Level 1

Beginner

  1. Covered in this level

    The level explains creating a free account, the main screen layout, searching for stocks and indices, switching between candlestick, bar and line charts, changing timeframes, zooming and scrolling, and adjusting chart colours and scale settings.

  2. Suited to

    This level is for learners opening TradingView for the first time. It focuses on finding your way around the platform so you can search for a symbol, view a clean chart and change the basic settings without feeling lost.

  3. What you will be able to apply

    You should be able to open a chart for any listed symbol, switch chart types and timeframes, set a clean, readable layout and navigate through past price history comfortably on the platform using both mouse and keyboard.

About this material

The material starts with the main areas of the TradingView screen: the symbol search, the top toolbar, the drawing panel on the left and the watchlist on the right. It then explains how to switch between candlestick, bar and line charts, change timeframes, and adjust scale settings such as logarithmic view.

Later sections show how to add and configure indicators, use drawing tools for trendlines, channels and horizontal levels, and save chart templates for reuse. Setting price and indicator alerts, organising watchlists and filtering stocks with the screener are also covered. The material explains which features are generally available on free accounts without recommending any paid plan, and notes that the platform's layout may change over time. It suits learners who want a practical workspace for chart study.