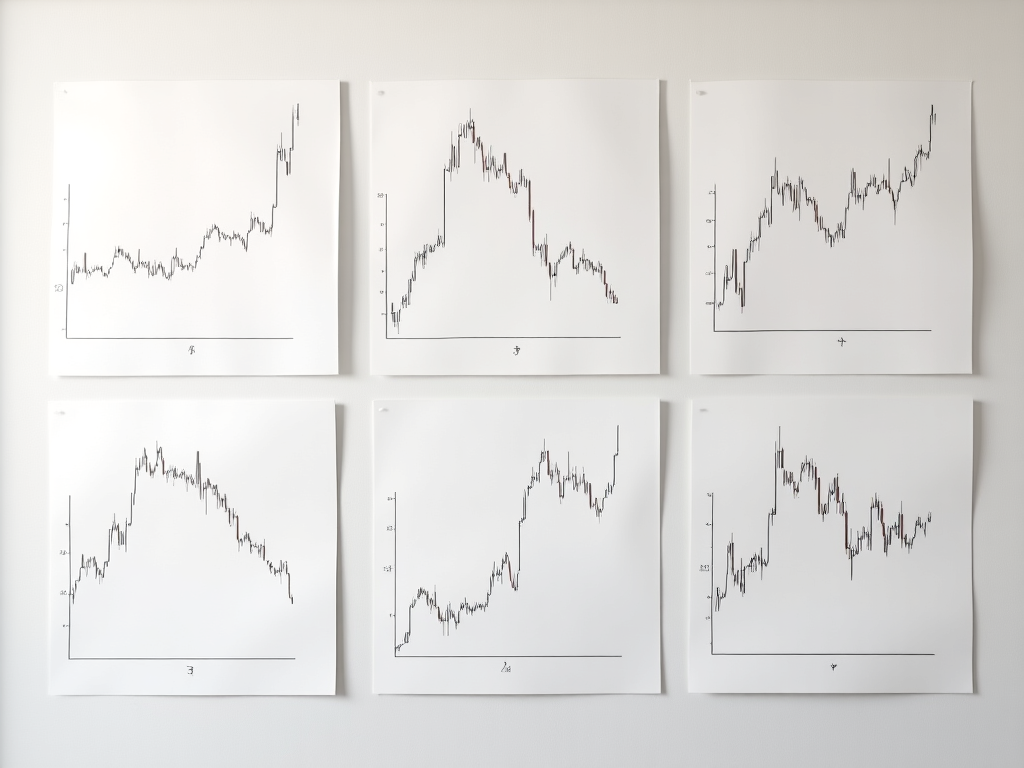
Chart patterns are graphical representations of price movements that help traders predict future market behavior. These patterns are categorized into reversal and continuation patterns. Reversal patterns signal a change in trend, while continuation patterns suggest the trend will persist. Common patterns include head and shoulders, double top/bottom, flags, pennants, and triangles. Recognizing these can provide entry and exit points. For example, a “cup and handle” pattern often signals a bullish breakout. The logic behind these patterns is rooted in investor psychology—how fear, greed, and crowd behavior shape price actions. This module provides visual illustrations of each pattern, their typical durations, volume signals, and success probabilities. Real chart examples are analyzed for better understanding. By learning to spot these patterns, traders can enhance their technical analysis and time their trades more effectively. This section is essential for those interested in active trading, as it adds a valuable toolset to their market approach.